
The problem
A dashboard is only useful if the data underneath it is timely and trustworthy. That means handling bursts, protecting the database, and making failures visible.
Most example projects stop at a chart. I wanted the full path: event producers, ingestion, storage, live delivery, and observability.
What I built
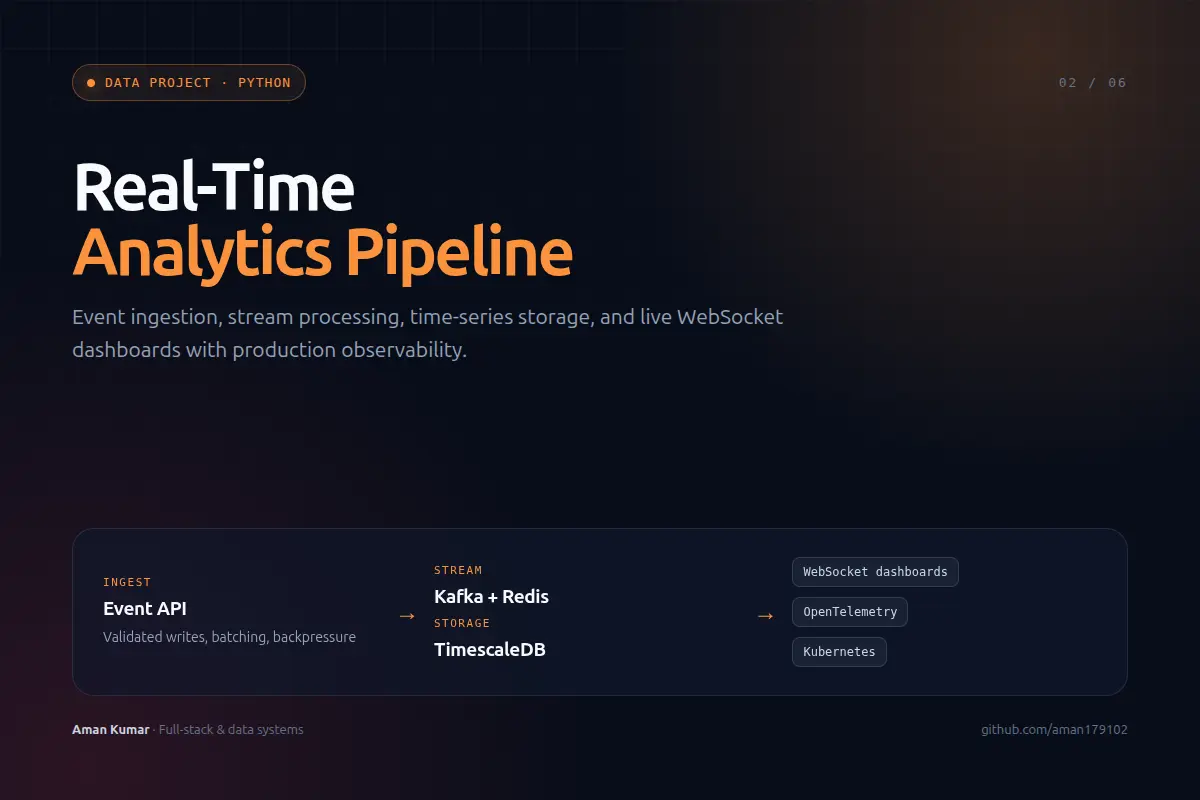
- A FastAPI ingestion service with validation, batching, and backpressure for bursty event traffic.
- TimescaleDB hypertables and continuous aggregates for efficient time-window queries.
- Redis and Kafka-backed processing paths for low-latency fan-out and durable stream handling.
- WebSocket dashboards, Prometheus metrics, OpenTelemetry tracing, Kubernetes manifests, and a test suite.
System shape
Decisions and tradeoffs
Separate the write path from the read path
Ingestion should not compete with dashboard queries. Batching and time-series aggregates keep both sides predictable.
Backpressure is a feature
When producers outrun the pipeline, rejecting or buffering deliberately is safer than letting memory and latency grow without bound.
Observability is part of the product
Metrics, traces, and health endpoints are not decoration; they are how you know the live number on screen is real.
Outcome
A production-shaped analytics reference with 2 GitHub stars, covering ingestion, time-series storage, live delivery, and the observability layer that makes the whole chain legible.
A live dashboard is a trust exercise. The pipeline has to show its work when the numbers move.